The shock priced in 31 days
Same oil price, different market. The variable that changed was not oil — it was the discount rate.
Thesis
Between 27 February and 30 March 2026, the S&P 500 fell 8.9% as the United States and Israel opened a war with Iran and the Strait of Hormuz effectively closed. The index then recovered the entire loss and added roughly 22% by mid-August, printing an all-time high on 13 August while the conflict was still active.
By September, Brent was back above $100 and the index was falling again. Same commodity price, different outcome.
The difference is the rate channel. In March, the market could discount an oil shock because policy was expected to ease into it. In September it cannot, because the shock has been running long enough to embed itself in core inflation, and the Federal Reserve is now debating a hike rather than a cut. Equity drawdowns caused by supply shocks are short. Equity drawdowns caused by the discount rate are not.
Timeline
| Date | Level | Event |
|---|---|---|
| 27 Jan 2026 | All-time high | Index peaks before the conflict |
| 27 Feb 2026 | — | Index closes below its 50-day moving average |
| 28 Feb 2026 | — | Operation Epic Fury begins. ~900 strikes in 12 hours |
| 19 Mar 2026 | — | Index closes below its 200-day moving average |
| 30 Mar 2026 | 6,316.91 | Cycle low. 8.9% below the January high |
| 31 Mar 2026 | +2.9% | Best single day of the year |
| 8 Apr 2026 | — | Conditional ceasefire declared |
| 5 May 2026 | — | Operation Epic Fury formally concludes |
| 2 Jun 2026 | Record close | Full recovery achieved |
| 5 Jun 2026 | −2.6% | Worst single day of the year |
| 9 Jun 2026 | 7,238.76 | Interim low |
| 11 Aug 2026 | — | Index ~22% above the 30 March low |
| 13 Aug 2026 | 7,816.70 | All-time high |
| 9 Sep 2026 | 7,636.49 | Brent tops $100. 10Y at 4.83% |
Peak-to-trough drawdown: −8.9%. Trough-to-peak recovery: +23.7%. Elapsed time from low to new high: 136 days.
Sources: Barchart, Advisor Perspectives, US Bank, TheStreet, Congressional Research Service.
What actually broke, and what did not
The intuitive read of a Hormuz closure is that it is an earnings event. It was not, at least not for the index.
With 91% of S&P 500 constituents reporting second-quarter results, aggregate revenue grew 15% and earnings grew more than 50% year over year. Third-quarter consensus called for revenue growth near 9% and earnings growth of 33%. FactSet estimates put full-year 2026 earnings growth at 17%, with another 17% in 2027.
An index whose earnings compound at that rate does not stay 9% below its high for long, regardless of the headline. The March low was a multiple event, not a profit event, and multiples repair quickly when the cash flows behind them keep growing.
The second observation is about breadth. At the March trough, the cap-weighted S&P 500 was down 6.96% year to date while the equal-weight index was down only 1.56%. The pain was concentrated in the largest names, not distributed. That is the signature of a duration selloff rather than a demand selloff, because the longest-duration cash flows sit in the mega-cap growth complex.
Small caps behaved consistently with the same reading. In the September session that took Brent above $100, the Russell 2000 fell 1.39% against the S&P 500's 0.48%. Smaller, more leveraged, more rate-sensitive balance sheets moved twice as hard as the index. Again: rates, not oil.
Why September is not March
Here is the comparison that matters.
| Late March 2026 | Early September 2026 | |
|---|---|---|
| Brent | ~$102 | ~$101 |
| Hormuz status | Functionally closed | Contested, attacks ongoing |
| Fed funds | 3.50–3.75% | 3.50–3.75% |
| Expected next move | Cut | Hike or hold, roughly even |
| US 10Y | Below current | 4.83%, 52-week high |
| US 30Y | Below current | 5.28% |
| Index vs high | −8.9% | −2.3% |
Oil is unchanged. Policy expectations inverted.
In March, the shock was read as deflationary at the margin: a demand hit that would pull the Fed forward. By September, six months of elevated energy had passed through into the core basket, headline CPI sat at 3.4% year over year, and Governor Waller had publicly floated a rate increase for the 15–16 September meeting. The August CPI print due 11 September became, in the words of one economist preview, precise enough that the second decimal place of core CPI mattered: a reading below 0.20% month over month was framed as roughly the condition for avoiding a hike.
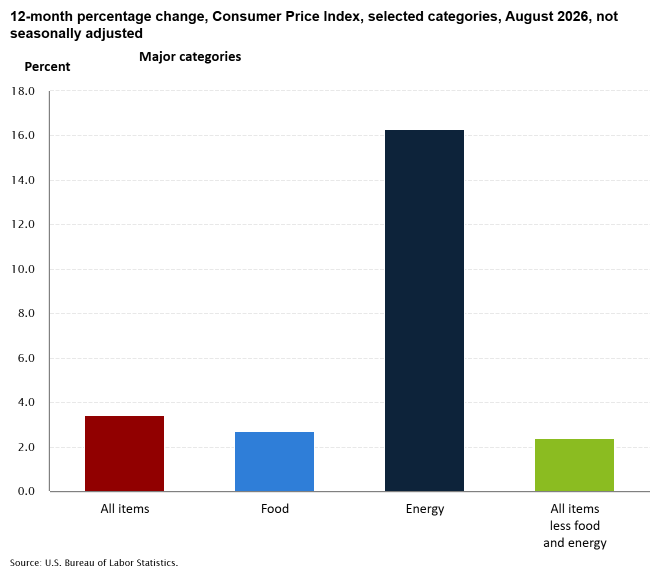
A market that has to care about the second decimal place of a monthly inflation print is a market being valued off the discount rate.
The cross-asset tell
One relationship in early September does not fit a normal risk-off pattern and deserves attention.
The dollar index fell to 98.79 while the US 10-year yield rose to 4.83%. The dollar weakened while the cost of borrowing dollars rose. Gold sat near $4,406, up 21.3% year over year, after an all-time high of $5,608 in January 2026.
Yields up, dollar down, gold up. That combination is not a growth scare and it is not a flight to quality. It is more consistent with a term premium story: investors demanding compensation for holding US duration for fiscal or inflation-persistence reasons rather than cyclical ones.
If that reading is right, the implication for equities is unpleasant. A term-premium-driven yield rise does not reverse when growth softens, which removes the usual automatic stabiliser under equity valuations.
Levels and the structure into the September FOMC
At the 9 September close the index sat below its 50-period EMA near 7,696.50.
- Immediate support: 7,640–7,650, then the early-September low near 7,620
- First reclaim: 7,670
- Structural resistance: 7,695–7,700
- All-time high: 7,816.70
Barclays raised its year-end 2026 target to 7,950 from 7,800, citing resilient corporate earnings and continued AI capital investment.
The bear case does not need an earnings miss. It needs Brent to hold above $100 long enough for the Fed to be forced into a hike, at which point the multiple compresses against earnings that are still growing. Goldman flagged that scenario explicitly: its base case has Gulf exports gradually recovering, but it warned Brent could exceed $120 in 2027 if Gulf output stays 4 million barrels per day below pre-war levels, with intensified shipping attacks in Hormuz and the Red Sea named as the most likely driver.
What I take from this
Three things generalise beyond 2026.
Supply shocks get discounted fast. The market needed 31 sessions to price the largest Hormuz disruption in two decades. Positioning for a slow, grinding repricing of a geopolitical headline would have been wrong.
The transmission channel is the discount rate, not the headline. The same oil price produced a shallow selloff in March and a persistent grind in September. Reading the commodity without reading the policy reaction function gives the wrong sign.
Breadth tells you which of the two you are in. When cap-weighted underperforms equal-weight by 5.4 percentage points, the market is repricing duration. When they move together, it is repricing demand. Those require different hedges.
Data as of 10 September 2026. Sources: Barchart, Yahoo Finance, Bloomberg, CNBC, TheStreet, Advisor Perspectives, US Bank, Trading Economics, Congressional Research Service. Analysis is for research purposes and is not investment advice.